01
Multi-timeframe structure
Track support and resistance from 5m, 15m, 30m, 1h, and 4h on the same five-minute chart.
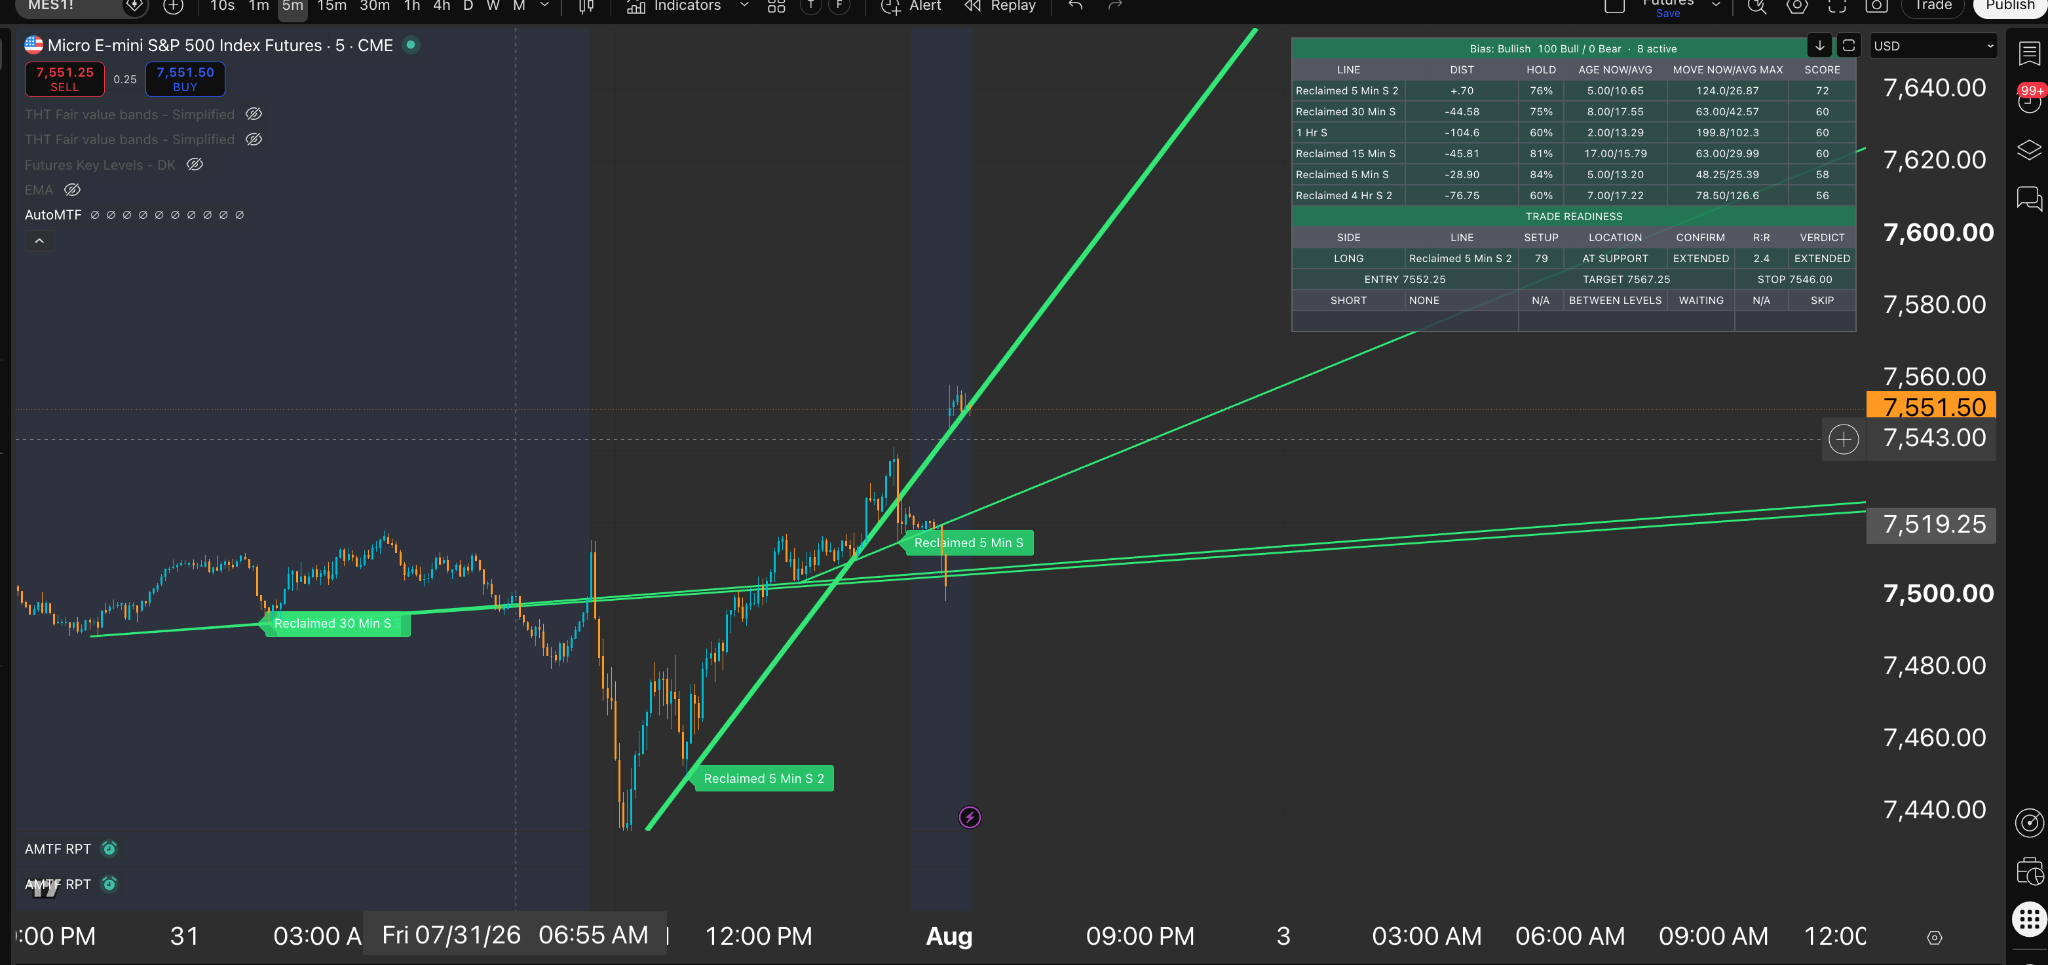
AutoMTF maps support, resistance, breaks, reclaims, historical movement, and trade-readiness context across five timeframes—directly on a five-minute chart.
Invite-only access on TradingView. Educational decision support—not financial advice.
What it does
AutoMTF organizes the structure that normally requires constant drawing, switching, and recalculating.
Track support and resistance from 5m, 15m, 30m, 1h, and 4h on the same five-minute chart.
Compare current movement with each line’s historical hold, reclaim, average move, and maximum move behavior.
See the selected line, entry, stop, target, reward-to-risk, opposing structure, and a clear GOOD, CAUTION, EXTENDED, or SKIP verdict.
Find the level. Check the context. Read the plan.
Green support, red resistance, gray broken lines, and reclaimed structure show where price is pressing or defending.
The consensus view ranks active structure while Trade Readiness turns the selected line into a complete risk plan.
AutoMTF provides context and structure. It does not guarantee outcomes or automatically place trades.
See it in action
The live visualization turns market structure and indicator telemetry into an evolving battlefield.
FAQ
AutoMTF is an invite-only TradingView indicator that maps multi-timeframe trendlines, historical line behavior, and long/short trade-readiness context on a five-minute chart.
The current workflow uses 5m, 15m, 30m, 1h, and 4h structure while running on a five-minute chart.
No. It is a decision-support and market-structure tool. You remain responsible for every trading decision and order.
Purchase access through Whop and provide your TradingView username. Invite-only access is then granted to that TradingView account.
Yes. The Beginner Guide explains the lines, labels, tables, hover statistics, and current Trade Readiness language.